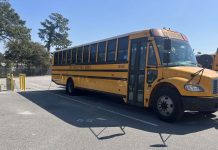
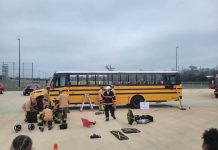
After releasing updated traffic safety facts over the summer, NHTSA said the average number of student fatalities in school bus crashes is now on average six per year, and an average of 12 student pedestrian deaths occur outside the bus, figures that mirror those of previously published federal data.
NHTSA updated its report “School Transportation-Related Crashes” to cover incidents recorded from 2001 through 2010. Of the 363,839 crashes over that period, NHTSA added that just shy of 3.5 percent, or 1,236 crashes, were classified as related to school transportation. In these crashes, 123 students under the age of 19 were killed.
Already this school year, and in the past month no less, an 18-year-old boy and a 10-year-old girl in Nebraska were killed when a semi trailer collided their school bus, and two female students were recently killed at the bus stop. An 11-year-old girl was killed in Texas City, Texas, on Monday was struck and killed by a big rig driven by her neighbor. According to news reports, the driver said he did not see the girl waiting at her bus stop when he rounded a street corner. Early the morning of Sept. 21, a 7-year-old girl was struck and killed by a school bus traveling in a rural area with no street lights while it was still dark outside, news reports indicated.
Michael Martin, executive director of NAPT, told School Transportation News that he is concerned about the deaths so early in the new school year. He also expressed a concern over what role driver distraction might be playing in the incidents.
Meanwhile, NHTSA found that 69 percent of the 123 total students killed in the years studied were struck by school buses, 26 percent were killed by other vehicles involved in crashes and 5 percent were killed in “vehicles functioning as school buses.”
Overall, 1,368 people were killed in school-transportation crashes, 72 percent of which were occupants of other non-school bus vehicles involved, for an average of 137 fatalities per year from 2001 through 2010. More than 7 percent of the fatalities were school bus occupants. Of the total 102 school bus occupant fatalities, 62 student passengers.
Aside from non-school bus occupants, pedestrians struck by the school bus represented the second largest fatality group with 199 deaths for an average of 20 per year. Nearly half of those deaths occurred to pedestrians 19 years and older, but 40 percent percent of school-age pedestrians killed were between 5 and 7 years old. Meanwhile, 38 pedestrians were struck and killed by another vehicle, an average of four per year.
The least safe time of day for students in school transportation-related crashes, regardless of what vehicle they were riding in or if they were a pedestrian, was from 3 to 3:59 p.m., when 106 of the total 375 fatalities occurred. Twenty one of those deaths occurred on the school bus.
The second least safe time for students was the period between 7 and 7:59 a.m., when 90 school-aged children were killed despite the vehicle in which they were riding or if they were a pedestrian.


